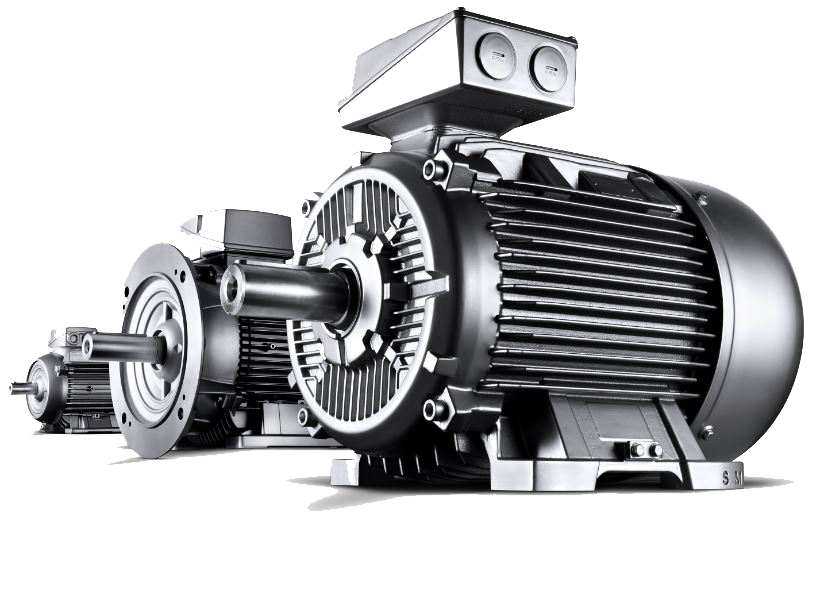
For this case study, an asset class model for electrical motors was built. The model development included building the governance layer or decision layer. The asset model contains functions, functional failures, failure modes and includes applicable maintenance tasks.
The decision layer produces a specific asset by answering questions such as:
“What type of motors is this?”
“What grease application is required by the motor bearings?”
The application of each decision answer to the model increases its specificity until it converges on the actual asset under consideration. The electrical motor model forming the basis of the case study represents the first link in the evolutionary chain. The asset class model was built to cover all variations operated by the dry bulk carrier. The inclusion of contextual elements such as environmental and operational parameters are also heavily skewed to what is relevant to them. RCMD is an evolutionary process and the intent is to expand and improve the model over time.
However, even the first iteration of the model and governance framework can produce specific assets representative of any electrical motor in their fleet. The model’s governance layer was fed information pertaining to 96 individual assets. From the 96 assets, 70 unique variants were identified. A unique variant can include multiple assets of the same make and manufacturer operating under identical conditions. Unique variants could be missed due to missing information. For cases where the decision questions can’t be answered, the model defaults to the most probable input.
After the model build and information compilation, two scenarios were run. For the first scenario the model was fed the current maintenance plan. This means the model could only perform maintenance tasks included in their current schedule at the prescribed intervals. After overlaying their maintenance plan, the model outputted the associated cost and risk profiles of each asset.
For the second scenario no specific maintenance plan was prescribed. The model was able to choose any task available to the model and schedule it at an interval it deemed optimum. Following the optimisation, the model outputted an optimised maintenance plan and its associated risk and cost profiles by asset.
The optimisation run produced eleven unique maintenance plans to be implemented. The optimised maintenance plan and its associated risk and cost implications was then compared to the current maintenance plan.
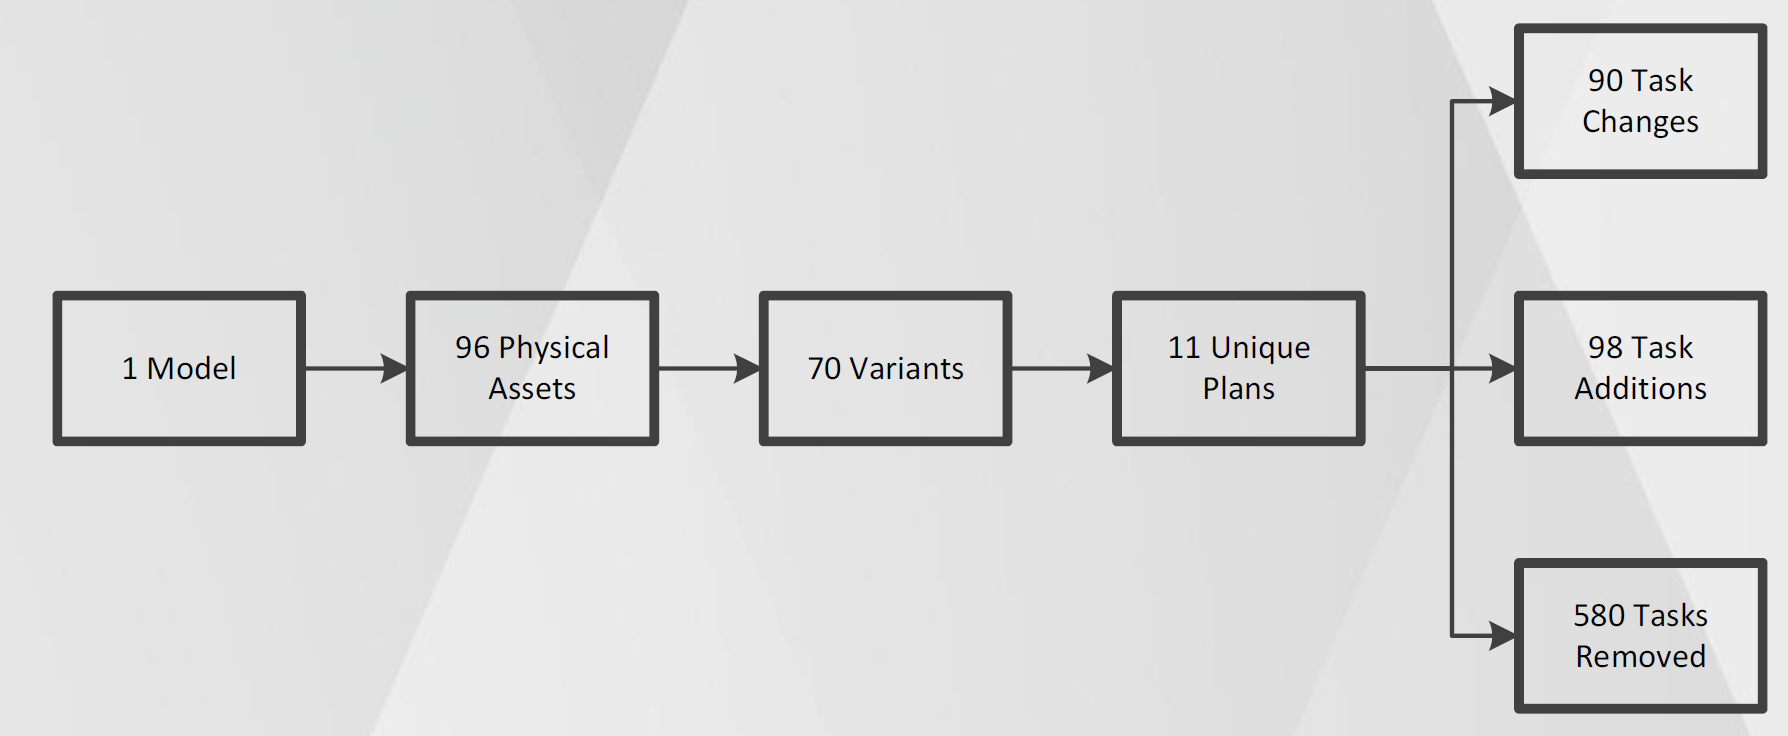
The results of the scenario modelling are outlined in Figure 1. For the 70 unique variants 11
maintenance plans were produced by the optimised scenario. Comparison between the current and
optimised maintenance plan resulted in 90 task changes e.g. interval changes, 98 additional
scheduled tasks, and the removal of 580 tasks.
The optimised scenario suggested a high number of tasks be removed. This primarily relates to
inexpensive non-critical assets. It illustrates that performing inspections or fixed time preventative
maintenance on inexpensive assets with no consequences upon failure are not cost beneficial.
1 Model
96 Physical Assets
11 Unique Plans
90 Task Changes
98 Task Additions
580 Tasks Removed
70 Variants
The remainder of the section explores the generated outputs in context of the two scenarios.
For each asset the analyses produce a risk profile. The risk profile is presented as a Probability Density Functions (PDF). Figure 2 show an example PDF comparing the associated risk between the current and optimised maintenance plan for an 18-year-old electric motor.
The risk profile is front loaded as the aging asset is nearing its end of life. The probability of failure then drops off, as it is unlikely that the asset will survive past this point to be able to fail. The optimised maintenance plan significantly dampens the risk exposure but does not completely flatten it.
The risk remains relatively high, but it does in fact represent an economic optimum where the risk of failure has been balanced against the increased maintenance tasks and frequencies. In addition, the model accounts for maintenance effectiveness shortcomings such as imperfect workmanship and potential failures going undetected during inspections.
Accounting for business specific maintenance regime characteristics is another method employed by the RCMD methodology to tailor results from the asset class model.
Figure 2: Risk profile for eighteen-year-old 185kW electric motor
The cost profiles explored in the subsequent section are all probabilistic and calculated of risk profiles as showed in Figure 2.
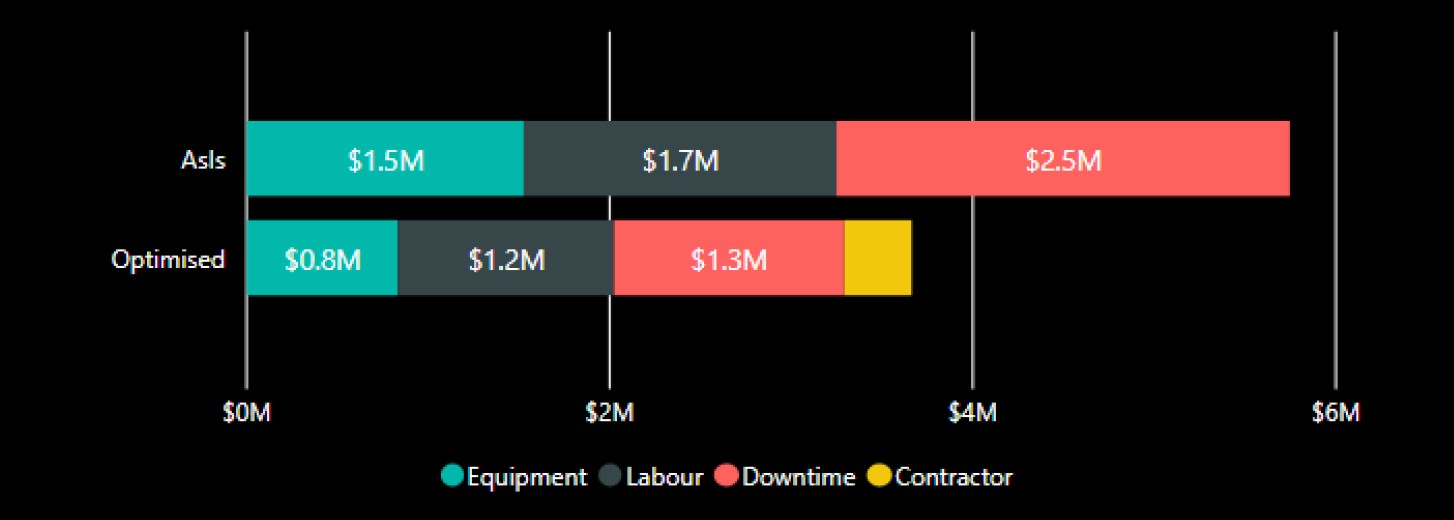
All costs and consequence information are business specific. Thus. as standard the methodology accommodates the ability to build up costs and consequences however a business deems fit. For the example showed in Figure 3 a relatively simple costing strategy was employed. The costs associated with maintenance tasks and consequences of failure were broken up into an equipment, labour, downtime and contractor component. However, more buckets such as environment and safety consequences can easily be included.
For the entire fleet of 96 motors the analysis predicted the business would spend $3,249,518 over 10 years maintaining its fleet of motors. Losses attributed to downtime adds another $2,496,879. The optimised maintenance plan reduced downtime losses by 49.2%. Even an optimised maintenance plan struggles to eliminate downtime given an average asset age of 14.75 years.
The optimised plan recommended employing contractors to perform thermography and vibrational analysis on critical motors. The cost is attributed to contractors as the business does not have the internal capability. Even with the addition of contractors, the direct maintenance costs (excl downtime) have been reduced by roughly $855,100 over a 10-year period.
We explored the total incurred costs over the full modelling window of 10 years. It is immediately evident that the optimised maintenance plan has dropped off non cost beneficial fixed time preventive maintenance activities at year 5 and 9. The mechanics of the model allows comparison to be made between any number of scenarios. This is useful to evaluate the economics of preventative replacements and their risk mitigation impact.
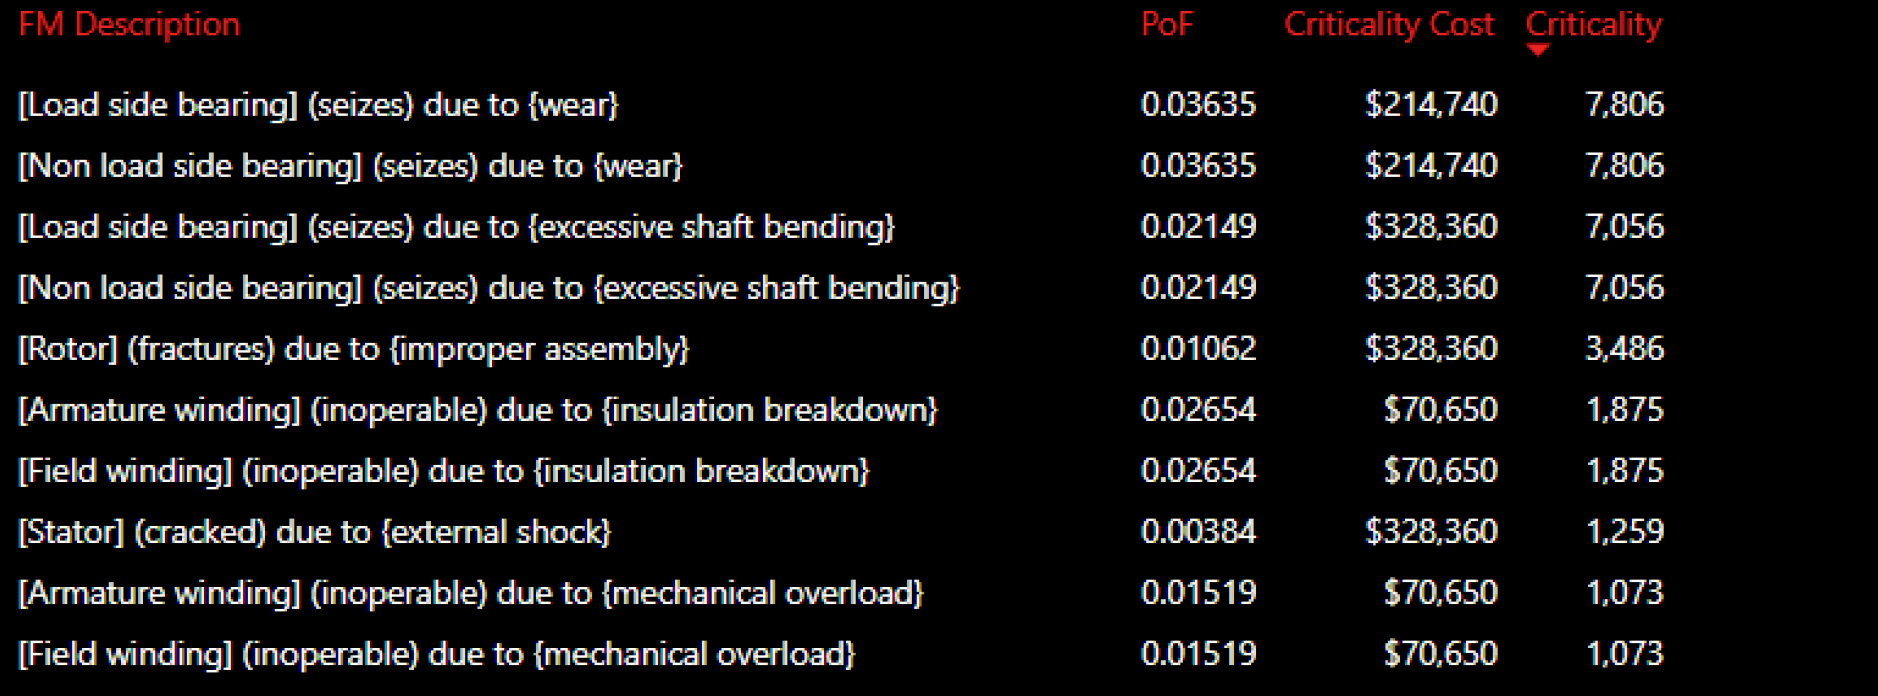
As standard the model produces a Failure, Mode Effects and Criticality Analysis (FMECA). In addition to outputting a FMECA before optimisation, a FMECA is also produced for the optimised maintenance plan. This allows for an easy comparison to assess how criticalities have changed across assets and components, and what remains high risk.
The FMECA outlined in Figure 5 shows a FMECA generated for same 18 year old asset depicted in Figure 2. The probability of failure calculated below is not a point measurement but represents the overall probability of failure across the modelling window of 10 years.
For each asset a task list is produced. As standard the task lists are not specific to any Computerised Maintenance Management System (CMMS), but can easily be transformed into any load sheet. Currently the task list does not go down to the level of work instructions and only provides high level tasks and the intervals at which they should be performed.
Lastly the analysis informs spare holding requirements at a high level. The tool does not perform a detailed analysis is terms of trading off holding costs, economic order quantities and lead times. However, it provides an indication of how many spares the business will need at any given point in time. The spare holding recommendation is split between spares required for corrective (unplanned) events and planned events.
Spares required for fixed time replacements are based on the actual optimised maintenance plan. In comparison, spares required for corrective or secondary tasks (finding a fault following an inspection) is determined probabilistically. In year one there is a minute probability of a bearing failure, thus the analysis recommends holding at least one spare in anticipation of the event, however unlikely it is.
The pilot study built a RCMD model of an electrical motor and produced optimised maintenance plans, risk and cost profiles for a fleet of 96 assets operated by a dry bulk and cargo carrier. The study represents the first chain in the evolutionary process. The initial build was more resource intensive than a traditional RCM analysis. However, the asset class approach means the model can now be applied and tailored to any vessel in their fleet with little to no lead time.
In comparison a traditional RCM analysis would be repeated verbatim with no cost or time saving. The RCMD approach also means any additional time spent on the model translate to improvements instead of rework. Over a few generations the model should be able accommodate a larger number of variants operated in several diverse environments.
The current version of the model passed initial quality reviews and produced outputs comparable to reality. If implemented the effectiveness of the maintenance plan can be reviewed against predictions. Part of Modla Technologies’ quality control involves performing root cause analysis on any discrepancies between the predicted and actual results. This filters back into the model to change assumptions and include new data and expert opinions as they come to light.